Methodology
Indicators Explained
Using the Formula
Hypothetical Data
The MUPI is calculated using data from a single household survey, and measures the headcount ratio of the population which is living in poverty, and the intensity of the poverty, as well as the overall Multidimensional Urban Poverty Index (MUPI).
-
Calculate the deprivation scores: The maximum deprivation score is 100% and there are three overarching categories, thus each is weighted 33.3%. Within this, the weight of each individual indicator is determined by dividing 33.3 by the number of indicators in the category. The sum of the indicators’ deprivation scores is the household’s total deprivation score. If it is over 33.3%, a household is considered multidimensionally poor. If it is between 20% and 33.3%, it is considered near multidimensional poverty, and if it is over 50%, a household is considered severely multidimensionally poor. Equation: c = ∑j Where c (household deprivation score) is the ∑ (sum) of j (indicator weight). Note: j must have a value of 1 in order to be included.
-
Calculate the headcount ratio: Equation: H = q/n Where H (distribution of multidimensionally poor throughout the population) is the quotient of q (number of people who are multidimensionally poor) over n (total population).
-
Calculate the intensity of the poverty: Equation: A = ∑1ci/q Where A (the percentage of weighted indicators in which the average poor individual is deprived) is the ∑ (sum) of c (household deprivation scores) multiplied by q (number of people in the household divided) by q (number of people who are multidimensionally poor).
-
Use these calculations to find the overall MUPI: Equation: MUPI = H⋅A Where MUPI (the overall multidimensional urban poverty index) is the product of H (the headcount ratio) and A (the intensity of the poverty).
-
Additionally, it is possible to calculate the contribution of a specific category, towards the overall MUPI score: Equation: Contribk = (∑j∈k∑1cij/n)/MUPI
Where Contribk (contribution of k, a category) is the ∑ (sum) of j (indicator weight) times ∑ (sum) of q (people in affected households) divided by n (number of people in household per indicator with a value of 1) divided by the MUPI.
Note: j must have a value of 1 in order to be included.

Note: Value of 1 represents deprivation within the indicator; 0 represents nondeprivation
Weighted deprivations:
Household 1: (1⋅11.1) + (2⋅6.6) = 24.3 percent.
Household 2: 70.9 percent.
Household 3: 35.4 percent.
Household 4: 58.7 percent.
Using the data from these four hypothetical households, it is possible to calculate the following.
Headcount ratio:
(0 + 7 + 5 + 4 / 4 + 7 + 5 + 4) = 0.800
80 percent of people live in poor households.
Intensity of poverty:
(70.9⋅7) + (35.4⋅5) + (58.7⋅4) / (7 + 5 + 4) = 56.8 percent
The average poor individual is deprived in 56.8 percent of the weighted indicators.
MUPI:
0.8⋅56.8 = 0.454
Contribution of deprivations in ...
Education:
Contrib1: [16.7⋅(7 + 4) + 16.7⋅7] / (4 + 7 + 5 + 4) / 45.4 = 33.0 percent
Health:
Contrib2: [11.1⋅4 + 11.1⋅(7 + 5 + 4) + 11.1⋅5] / (4 + 7 + 5 + 4) / 45.4 = 31.6 percent
Living conditions:
Contrib3: [6.6⋅(7⋅4 + 5⋅2 + 4⋅3)] / (4 + 7 + 5 + 4) / 45.4 = 35.4 percent

We have learned about the indicators which the UN uses to calculate its Multidimensional Poverty Index (MPI), and we have researched and proposed the same number of indicators to calculate our Multidimensional Urban Poverty Index (MUPI). The UN indicators fall under three broad categories: education, healthcare, and living conditions. While we have kept the same categories for our indicators, we have chosen to include three healthcare indicators and five living condition indicators, rather than the respective two and six that the UN employs. Below you will find a brief explanation of each UN indicator, as well as a more in-depth explanation of our selected indicators, and data which proves that our indicators form a comprehensive picture of urban poverty in more developed countries.
Education:
MPI:
Indicator #1: Years of schooling
No household member has completed at least six years of schooling.
Indicator #2: Children enrolled
A school-aged child (up to grade 8) is not attending school.
MUPI:
Indicator # 1: High school completion
One or more members has not completed high school. Students from the bottom twenty percent of all family incomes are over five times more likely to leave high school, compared to students from the top twenty percent (Chapman et. al., 2011, Table 1). This can also partially be attributed to the need for youth to contribute to household budgets, as below.
Indicator # 2: Child financial contribution
One or more members under the age of 18 has had to work in order to contribute to household finances. Although poverty is not just a measure of economic value and stability, children “sacrificing their educations for low skill labor … increases vulnerability within a household [and] perpetuates poverty from one generation to the next.” (Li, 2013, p. 2) Children working also means that their health and well-being, as well as their childhood can become compromised, thus adding to the cycle of poverty and fostering the mindset solely of survival, from the beginning of their lives.
Healthcare:
MPI:
Indicator #1: Nutrition
A household member is malnourished, as measured by the Body Mass Index (BMI) for adults, and by the height-for-age z-score calculated based on World Health Organization standards for children under age 5.
Indicator #2: Child mortality
A child has died in the household within the five years prior to the survey.
MUPI:
Indicator #1: Diagnosis/treatment
One or more members has struggled to receive diagnosis/treatment for a possible illness or health-related condition. Because poverty is partially, though not completely, affected by financial ability, diagnosis and treatment can be extremely difficult to afford even if there is an existing free national healthcare. Additionally, studies by Heidi Allen (et. al.) and Christine Loignon (et. al.) further support the belief that stigma around low-income patients, perpetuated by health care providers and systems as well as the patients themselves, is another major obstacle posed when low-income individuals seek treatment.
Indicator #2: Regular health services
One or more members has struggled to obtain health-related services such as annual dental check ups, prescriptions, mental health support etc. A Hamilton, Ontario report on life expectancy found that its richest residents were expected to live, on average, 21 years longer than their poorer counterparts. “Maintenance” health services such as dental care, prescriptions, physiotherapy, and counselling, have been proven to be just as beneficial as regular medical visits, and their addition to the lives of poorer individuals could as a result add several years to the individuals’ lives.
Indicator #3: Nutrition
Nutritional requirements are not being met due to inaccessibility, unaffordability, lack of suitable storage options etc. One in eight households encounter food insecurity, according to the Dietitians of Canada, and they are even more likely to if the members are Indigenous, if they work for a minimum wage or receive social assistance, or if they are a single parent family. Food insecurity can thus only be alleviated through eradicating poverty and material deprivations (Dietitians of Canada, 2015).
Living Conditions:
MPI:
Indicator #1: Electricity
Not having access to electricity.
Indicator #2: Water
Not having access to clean drinking water or having access to clean drinking water through a source that is located 30 minutes away or more by walking.
Indicator #3: Toilet
Not having access to improved sanitation facilities or having access only to shared improved sanitation facilities.
Indicator #4: Floor
Having a home with dirt, sand or dung floor.
Indicator #5: Cooking fuel
Using “dirty” cooking fuel (dung, wood or charcoal).
Indicator #6: Assets
Not having at least one asset related to access to information (radio, television or telephone) or having at least one asset related to information but not having at least one asset related to mobility (bike, motorbike, car, truck, animal cart or motorboat) or at least one asset related to livelihood (refrigerator, arable land or livestock).
MUPI:
Indicator #1: Core housing need
Household is in core housing need according to national standards. This means that the housing does not meet one or more of the adequacy, suitability or affordability standards, and members would have to spend 30% or more of their before-tax income in order to obtain adequate local housing. More information can be found here. Both the standards piece and the income piece are noticeably linked to poverty; nine in ten families living in older rental buildings were living in a state of inadequacy, and 50.4% of low-income households were found to be in core housing need in 2011 (Canada Mortgage and Housing Corporation, 2011, n.p.; Paradis et. al, 2014, p. iii).
Indicator #2: Electricity, water, energy
The electricity, water, and energy services are unreliable and/or unsafe. In most low-income areas, and especially on Canadian First Nations reserves (some of which are urban), it is extremely common to find contaminated water, and poor sanitation in general. While instances like these are high, with CBC’s Matthew McClearn reporting that one third of all Canadian First Nations lacking clean drinking water, they are often not reported on or publicized (McClearn, 2017, n.p.).
Indicator #3: Informational assets
Services such as employment centres, low income housing opportunities, and income-based savings are unreachable due to hours, locations, or accessibility. Facilitating the dispensation of information on jobs and community engagement, including resources on voting, policy changes and institutional developments encourages inhabitants to remain informed, and allows them to maximise their options.
Indicator #4: Reliability of housing
Household has repeatedly been threatened with eviction within the past year, or has had to be dependent on others for shelter within the past year. A 2009 count done by Margaret Eberle and colleagues estimates that for every homeless person, there are 3.5 other hidden homeless people, indicating that homelessness is a much larger issue than at first glance, especially since it has only grown in the past ten years. Moreover, Matthew Desmond’s book Evicted (2016), provides a comprehensive view of the immense population that lives in fear of being evicted, and experiences large-scale urban poverty as well.
Indicator #5: Transportation assets
Transportation assets such as a car, transit passes, bikes, etc. are inaccessible due to cost, distance, location, maintenance etc. Length of commuting time has been directly linked to a child’s economic prosperity, according to Raj Chetty and Nathaniel Hendren of Harvard University. Specifically, “the longer [the commute], the worse the chances of low-income families … moving up the ladder” (Bouchard, 2015). Subsequently, having little or no access to transportation methods such as those above can not only perpetuate the cycle of poverty, but it can also worsen it.

Measuring Poverty
Measuring Urban Poverty
MPI Hypothetical Data:
MUPI Hypothetical Data:
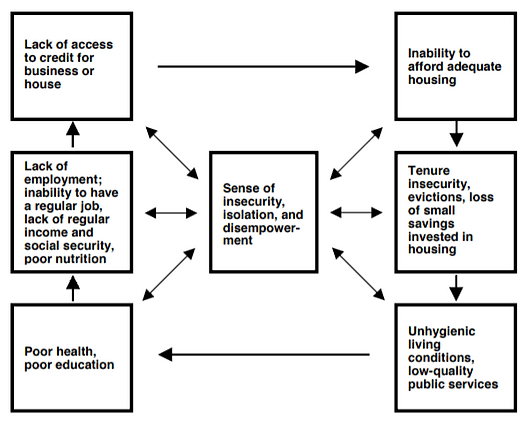
Similarly to our indicators, this image by Baharoglu and Kessides illustrates the sequence often found within poor urban areas. Many of the ideas found above are reflected in the indicators, including poor nutrition, health, and education, low-quality public services, evictions, and the inability to afford adequate housing.
Note: UN indicator descriptions have been taken directly from the United Nations' Human Development Report's Technical Notes on Human Development Indices.
Figure 16.1 Cumulative Impacts of Urban Poverty (Baharoglu and Kessides, 2002, p. 127)
